clustering
Clustering spatiotemporal mobility data of NYC bikes.
We collected data on millions of city bike trips from NYC and started thinking how to synthesize them. We came up with this idea of ‘vector of movement’ that aggregates mobility pattern into a single vector. With this we may now cluster big datasets into groups of similar patterns and provide more accurate mobility predictions (including weather)
Work initiated with a North Gravity for our AWS Data Science framework demo, followed with Guido Cantelmo at TU Munich, presented at TRB 2020 (DC), MATTS 2019 (Delft) and published in TRR
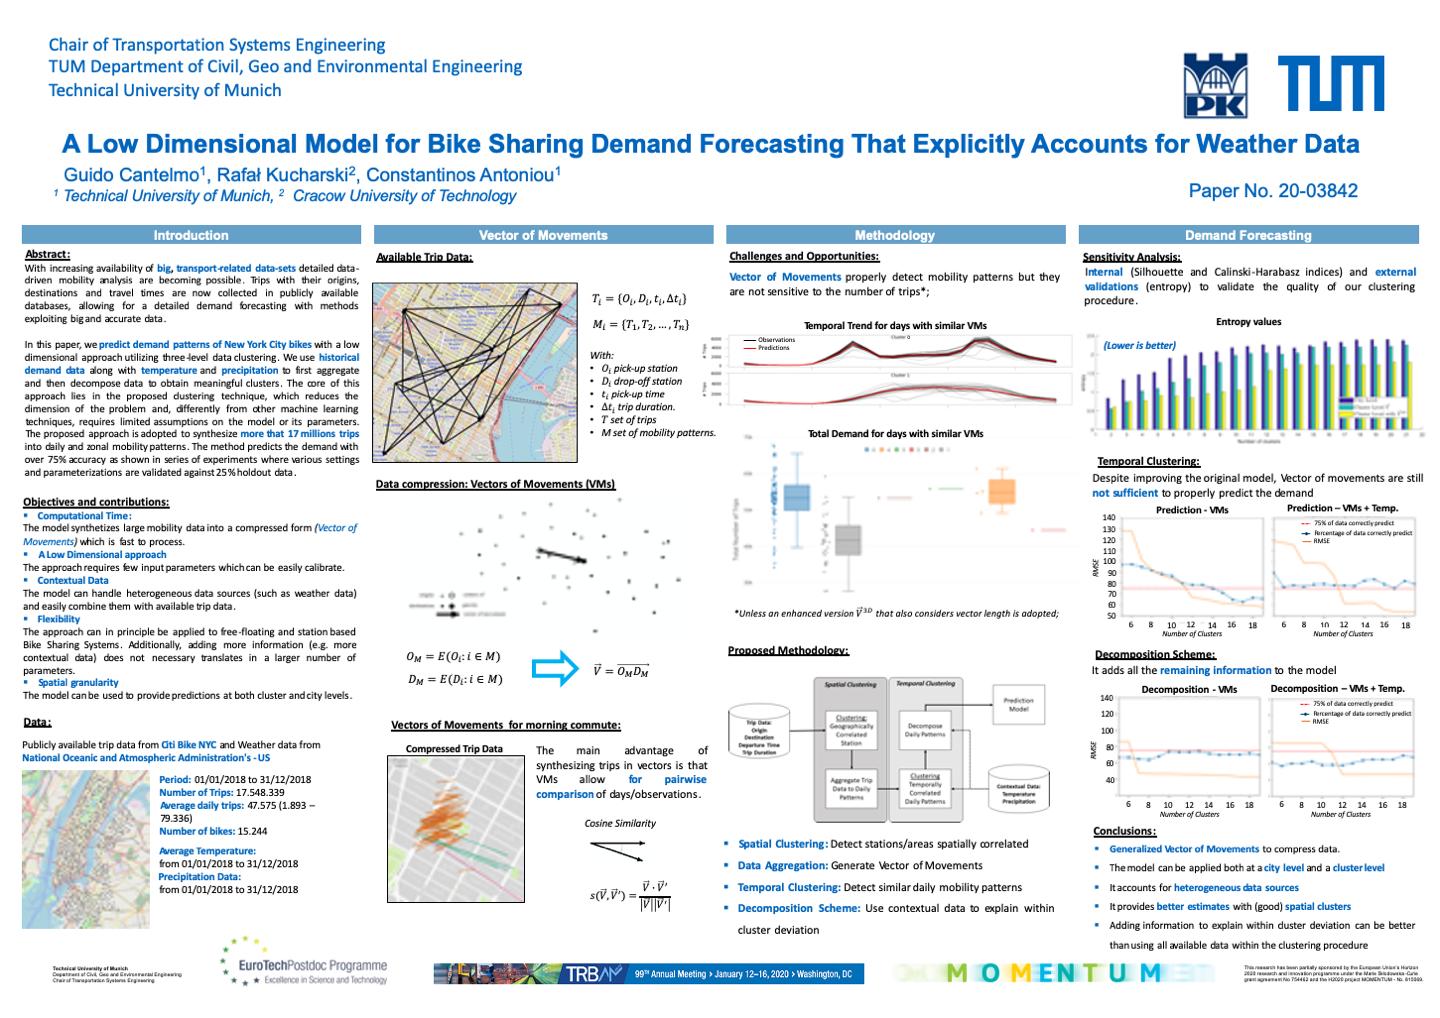
With the increasing availability of big, transport-related datasets, detailed data-driven mobility analysis is becoming possible. Trips with their origins, destinations, and travel times are now collected in publicly available databases, allowing for detailed demand forecasting with methods exploiting big and accurate data. In this paper, we predict the demand pattern of New York City bikes with a low-dimensional approach utilizing three-level data clustering. We use historical demand data along with temperature and precipitation to first aggregate and then decompose data to obtain meaningful clusters. The core of this approach lies in the proposed clustering technique, which reduces the dimension of the problem and, differently from other machine learning techniques, requires limited assumptions on the model or its parameters. The proposed method allows, for the given temperature and precipitation method, to obtain expected vector of movement (mean number and direction of trips) for each zone. In this paper, we synthesize more than 17 million trips into daily and zonal vectors of movement, which combined with weather data allow forecasting of the trip demand. The method allows us to predict the demand with over 75% accuracy, as shown in series of experiments in which various settings and parameterizations are validated against 25% holdout data.