big data
Uber versus PT in 6 cities - spatial analyses
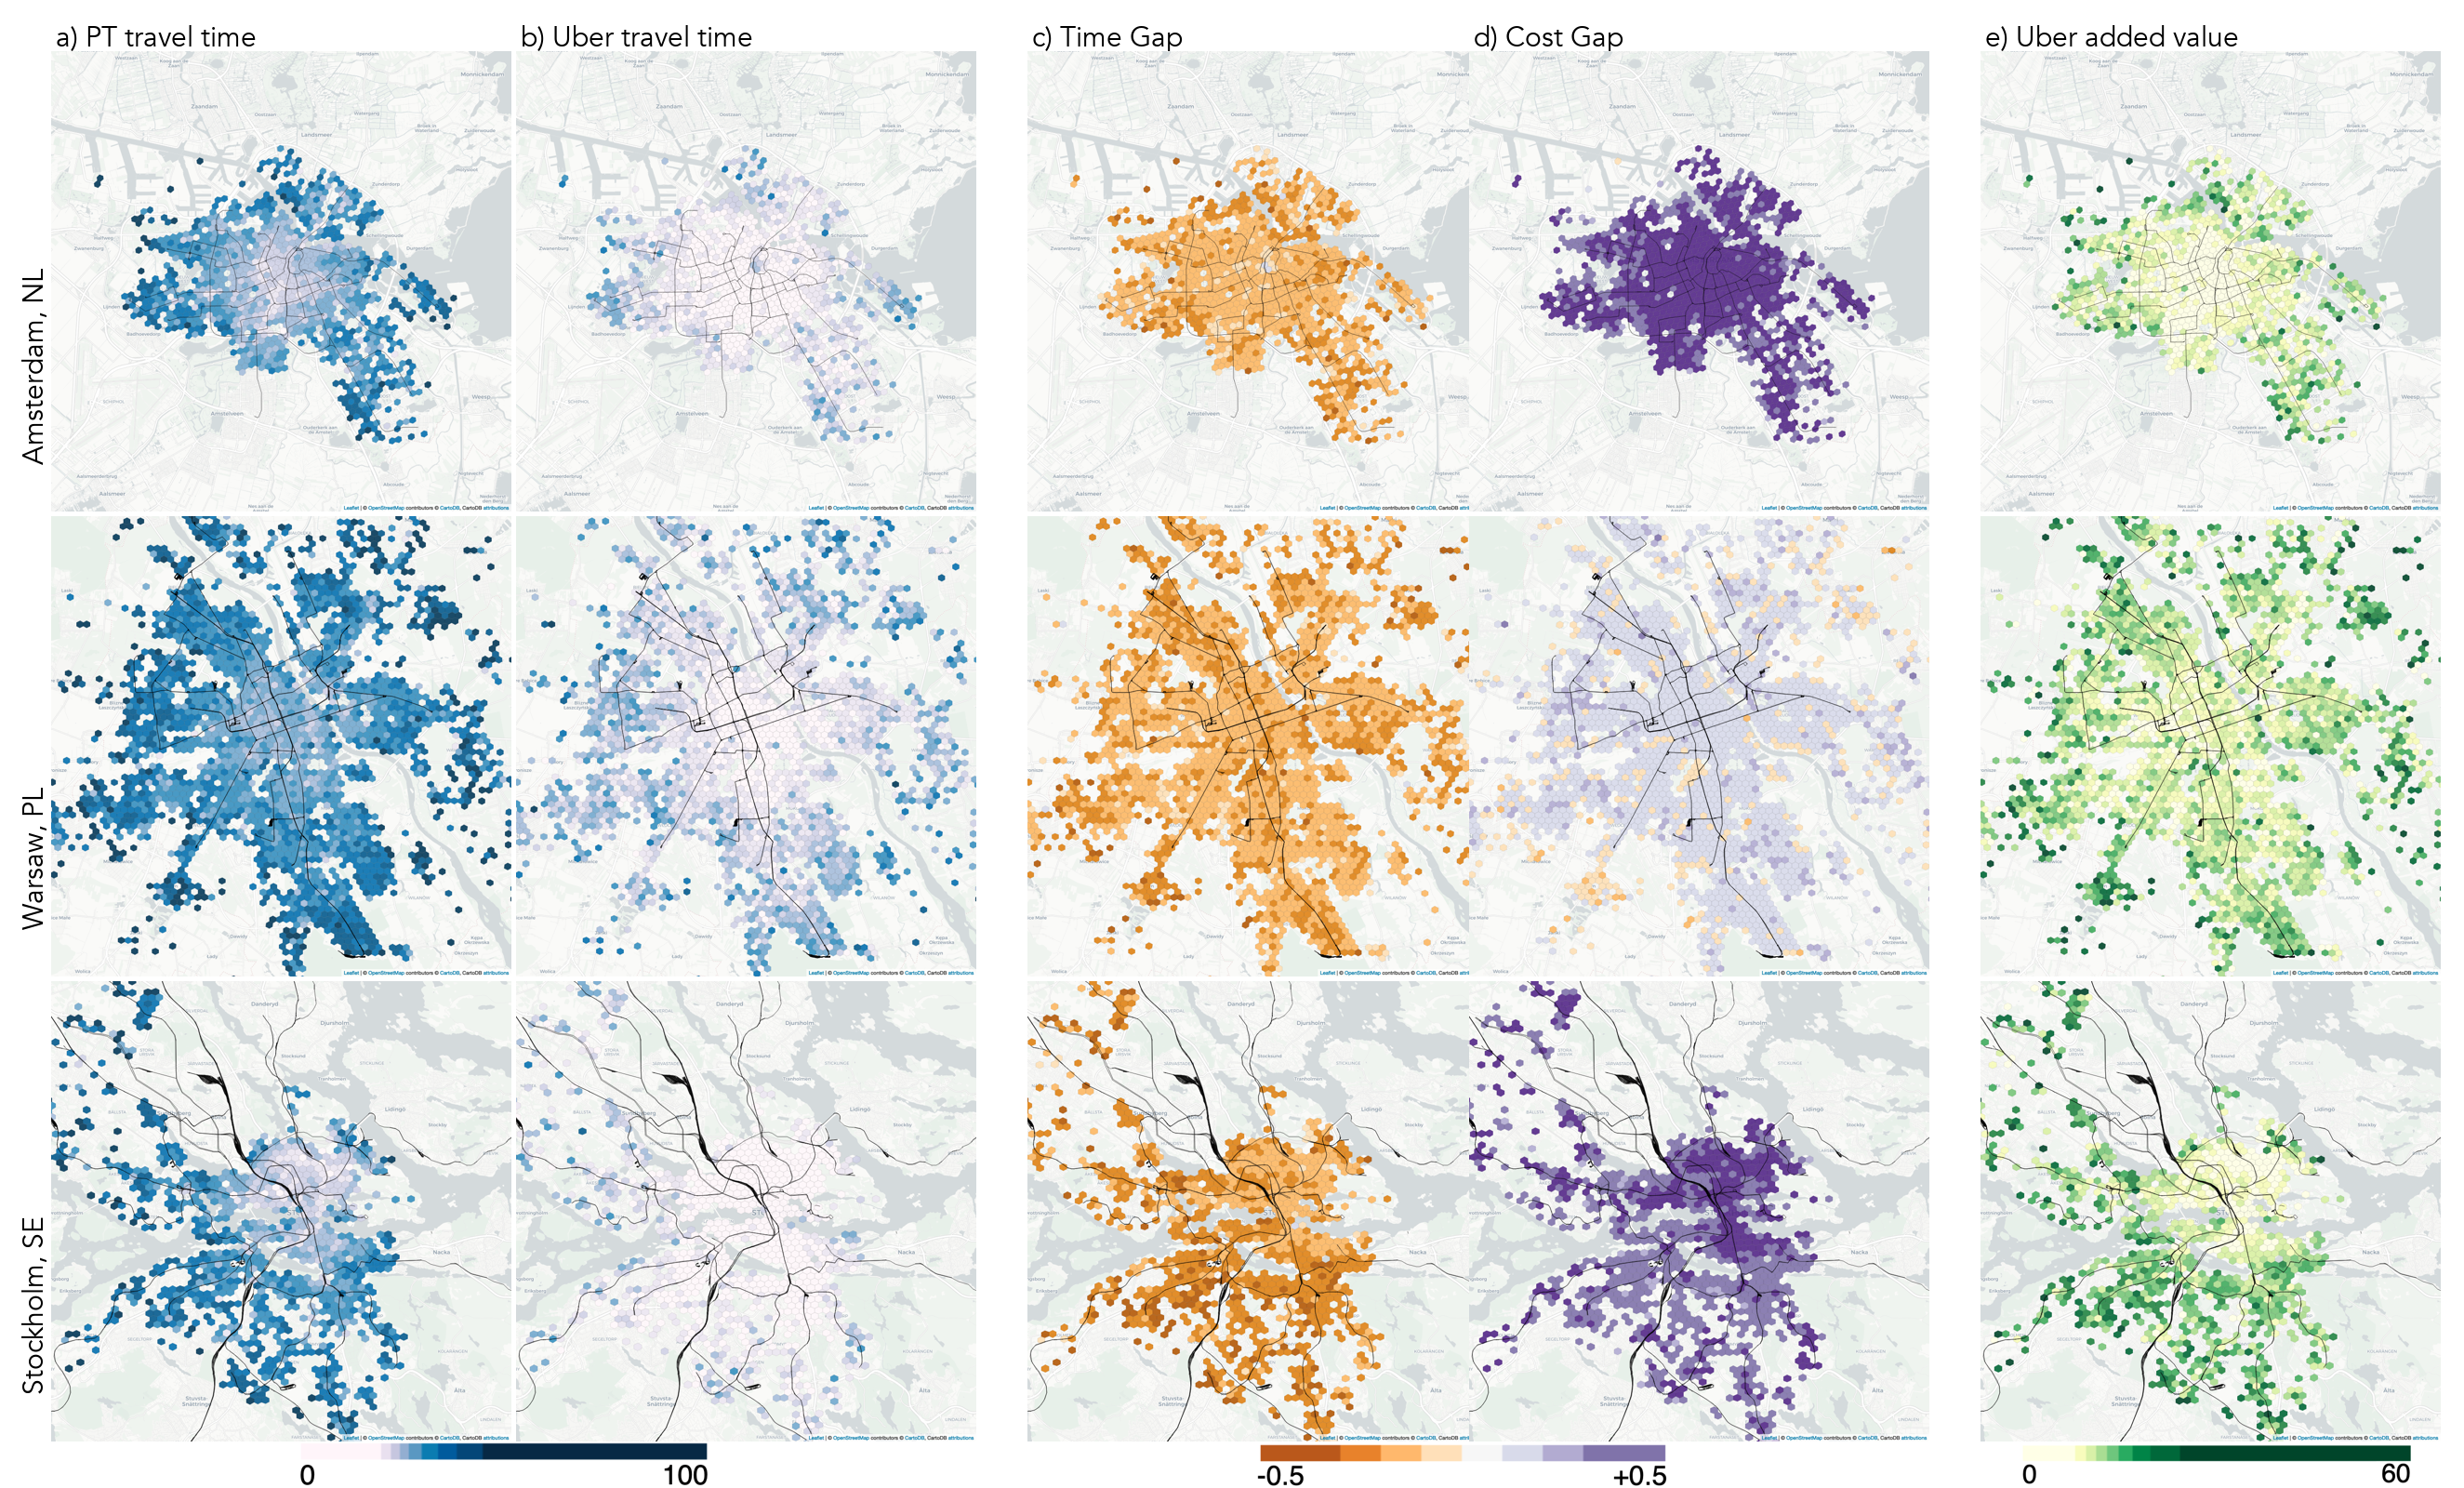
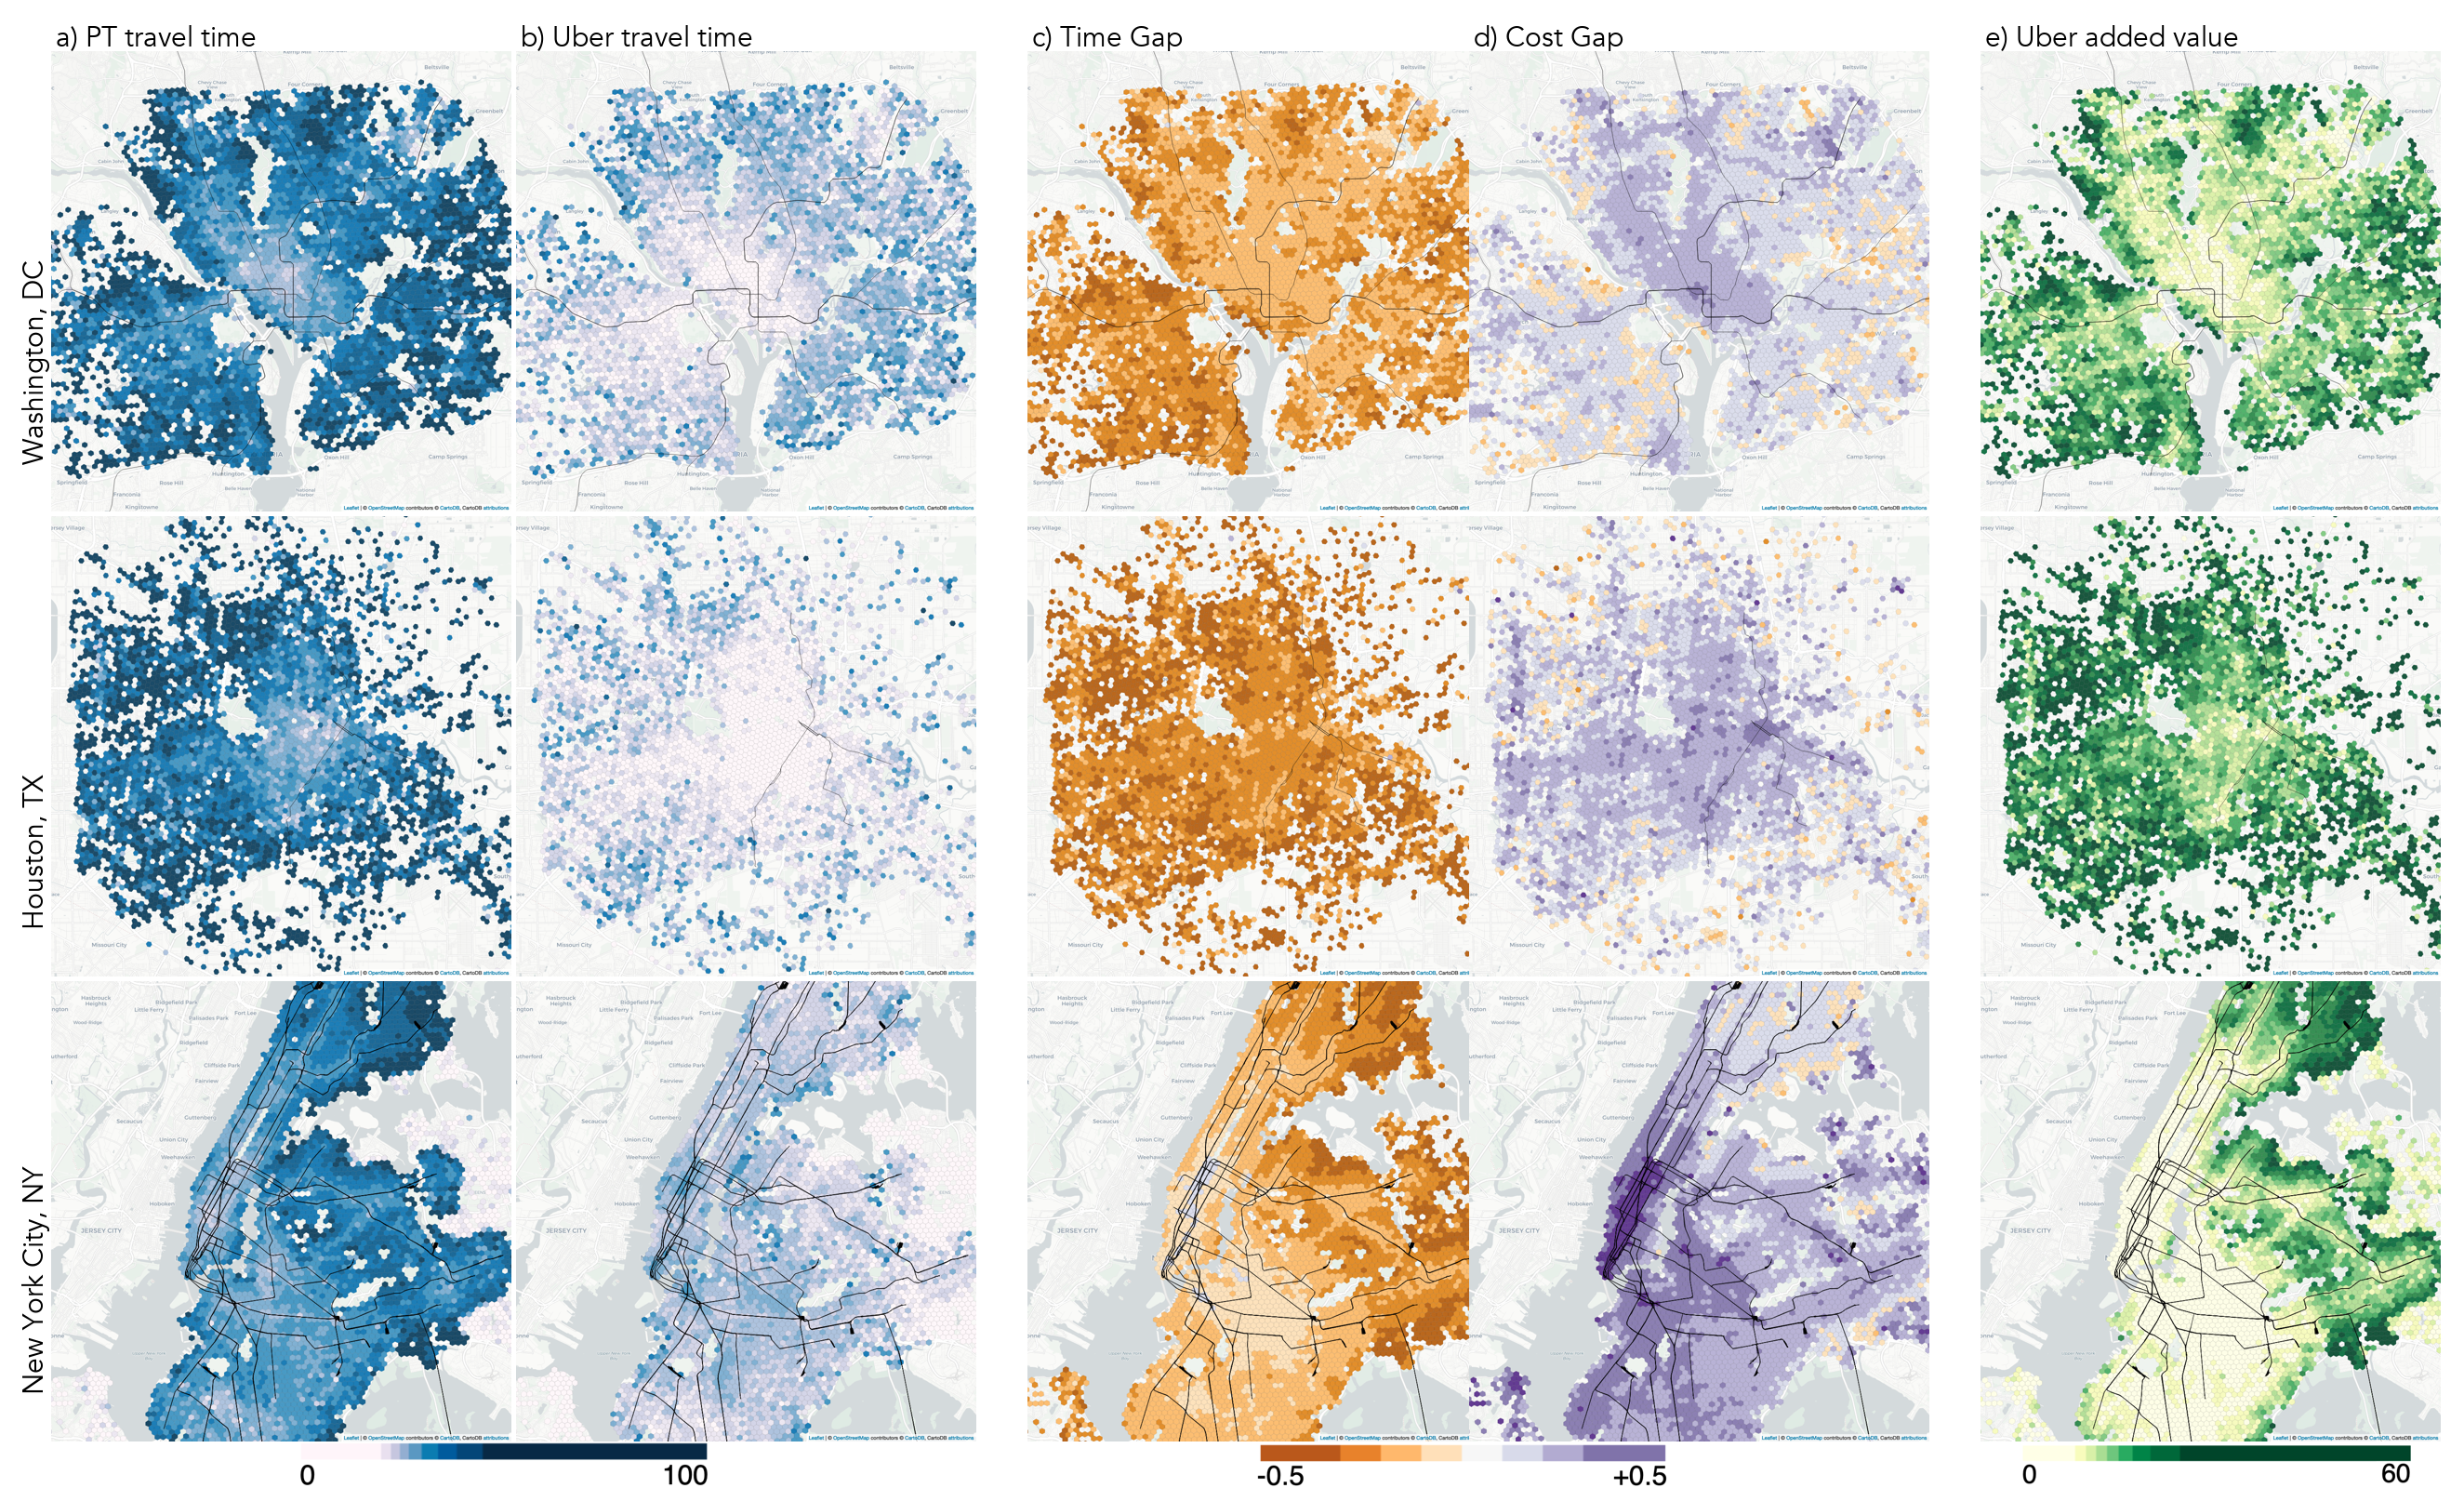
Uber shared with us rich spatiotemporal data on 3 million trips from 6 cities in EU and US. We fused them with PT alternative and explored complex spatiotemporal patterns.
Presented at TRB 2021 in Washington, DC and published in PLOS One with Santosh Rao Danda (Uber), Menno Yapp (Transportation for London) and Oded Cats (TU Delft)

Since ride-hailing has become an important travel alternative in many cities worldwide, a fervent debate is underway on whether it competes with or complements public transport services. We use Uber trip data in six cities in the United States and Europe to identify the most attractive public transport alternative for each ride. We then address the following questions:
- How does ride-hailing travel time and cost compare to the fastest public transport alternative?
- What proportion of ride-hailing trips that do not have a viable public transport alternative?
- How does ride-hailing change overall service accessibility?
- What is the relation between demand share and relative competition between the twoalternatives?
Our findings suggest that the dichotomy - competing with or complementing - is false. Though the vast majority of ride-hailing trips have a viable public transport alternative, between 20% and 40% of them have no viable public transport alternative. The increased service accessibility attributed to the inclusion of ride-hailing is greater in our US cities than in their European counterparts. Demand splitis directly related to the relative competitiveness of travel times i.e. when public transport travel times are competitive ride-hailing demand share is low and vice-versa.

